Every election number is made, not found. The polling average, the election-night call, the market price, the count, and the certification are five different instruments, built by different makers on different bases, and in 2026 they disagreed by margins that mattered: about four points on the national House vote, seven points in New York, twenty-five to twenty-eight seats in the published models. The count that grades them all is itself produced county by county and stays semi-official until December 11. What follows takes the stack apart, instrument by instrument.
At 8:01pm Eastern Time on November 3, 2026, one minute after Pennsylvania's polls closed, the Associated Press called the state's governorship for Josh Shapiro. On the Pacific coast, the AP called the California governorship for Xavier Becerra at 8:00pm Pacific Time, the moment California's polls closed. Neither call rested on counted votes: Pennsylvania's counties had reported effectively none at 8:01pm, and California's had reported none at 8:00pm. The AP's decision desk produced the Pennsylvania call from exit polling, pre-election surveys, and a model of the outstanding vote. The inputs used for the AP’s California call are not in the public record. As of November 6, the counted votes support both AP calls. Pennsylvania reports 60.4 percent for Shapiro with 98.8 percent of precincts reporting. California reports 64.7 percent for Becerra, in results that remain semi-official until the Secretary of State certifies them on December 11.
Such election-night calls are a newsroom product made under deadline, attempting to close the public story of an election hours or weeks before the count closes the legal one. In the case of Pennsylvania and California, anyone watching in those minutes after the polls officially closed were presented with projected winners before any votes were counted, based on a forecast that was presented as a count.
Elections generate a number of inputs from different sources, of varying authority, accuracy and precision. Yet, each election, public discussion and media pundits condense these stacks of figures into a ratio (sometimes with a probability) and an assertion of who will win and who will lose. Survey firms sample a subset of the electorate weeks, and sometimes even days, before the vote only to hand off the data to an aggregator that averages the survey results, without necessarily revealing their methodology. The media decision desks then call races based on modeling and partial returns. In contrast, the recent addition of prediction markets introduces a new data type that seeks to price the outcome of events like elections based on traders' money, often repricing the bet as new data shapes the bets people place, making them removed but not independent of the polls.
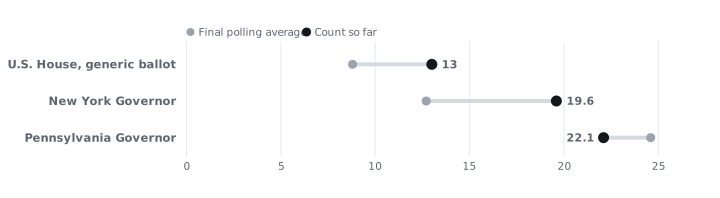
In contrast to these predictive methods, the county officials have access to the real data, the ballots. But, unlike the surveys or the prediction markets, their tallying takes days and sometimes weeks, in preparation for a secretary of state to certify a final figure. In some cases, more than a month after election day. Each instrument has a maker, a method, a base, and its own weaknesses. The 2026 midterms ran every instrument in the stack against the same elections. In Pennsylvania, so far, the instruments agreed: final averages put Shapiro ahead by 23.8 and 24.6 points, the Associated Press called the race one minute after the polls closed, and the count stands at a margin of 22.1 points. In New York the polls named the right winner and understated her margin by about 7 points. Nationally the final average missed the House vote by about 4 points, the seat models missed by 25 to 28 seats against their center, and the prediction markets sat below the poll-based models on Senate control all autumn.
The control case: Pennsylvania
Pennsylvania's governorship is the race where every instrument agreed. RealClearPolitics averaged five polls fielded between September 15 and October 18 and put Shapiro ahead of Stacy Garrity by 23.8 points. An average published November 1 by On Point Politics put the margin at 24.6 points. The count, reported county by county with 98.8 percent of precincts in, stands at 60.4 percent for Shapiro and 38.3 percent for Garrity, a margin of 22.1 points. The polls missed the margin in the reported count by roughly two points.
The call's speed followed from the forecast: a decision desk can project a winner at one minute past closing when the expected margin exceeds twenty points, because no plausible count could reverse a twenty-point margin. Call speed measures forecast margin. It tells a reader nothing about counting speed.
The race's money was as one-sided as its forecasts. Shapiro's campaign spent about $66 million by late October, drawn from campaign filings reported by WESA, while Garrity's campaign spent $6.8 million over the same period, a ratio of roughly ten to one.
Since every published average had the challenger more than twenty points behind, and everyone knew her campaign was outspent ten to one (with the assumption money buys elections), for most, the public picture of the result was settled before the count; in this case, it happened to be accurate. Pennsylvania's value as a control case rests on that verification rather than on the convergence that preceded it. The instruments that agreed in Pennsylvania share inputs and conventions: averages aggregate overlapping polls whose firms screen likely voters and weight respondents to demographic targets. Convergence among such instruments is also what systematic error looks like before a count arrives. Pennsylvania is the baseline because the count as reported stands where the instruments pointed, and the size of the difference, about two points, is the quantity the other cases will be measured against with the benchmark a reported count rather than a settled one because the county boards have until November 23 to certify their returns to the Secretary of the Commonwealth, and state law sets no fixed date for the secretary's certification.
The inverse case: New York
New York's governorship inverts the Pennsylvania pattern. RealClearPolitics published a final average of 53.5 percent for Kathy Hochul and 40.8 percent for Bruce Blakeman, a margin of 12.7 points. The AP count gives Hochul 3,593,635 votes and Blakeman 2,416,598, a margin of about 19.6 points with write-ins included in the base. At time of this writing, the count remains preliminary: it is assembled from the unofficial returns of the state's county boards of elections, ahead of the state board's certification on December 15. What is clear is the polls understated the winner's margin by about seven points. Still, the AP called the race within minutes of the polls closing while being correct because the numbers left little doubt requiring a hedge.
While the outcome was not in doubt after election night, the error margin still mattered: a margin carries the mandate story written about a result and the expectations that down-ballot candidates and party organizations plan against. A race described at 53.5 to 40.8 shapes those outcomes differently than if it were 60 to 40, though the same candidate takes the oath either way.
Siena's final survey of the race published a second kind of number beside its vote intention figures: 68 percent of New York voters expected Hochul to win, including 40 percent of Republicans. Expectations questions ask respondents to report what they believe will happen rather than what they intend to do. A share of voters expecting an outcome is not an estimate of the outcome's margin, and placing a belief figure and a count on one scale would treat two different quantities as one measurement. The pairing shows one survey program, in one field period, offering its readers two instruments for the same race, built on different questions. Why the two instruments diverged is a question the published figures alone cannot answer. The choice between the instruments is substantive, and survey organizations make it when they choose the questions, on behalf of every reader who later cites the results.
Error attaches to a specific instrument measuring a specific race in a specific place: the Pennsylvania polls missed by about two points and the New York polls by about seven. Such errors are inherent to the nature of the method and its technology rather than evidence of their failure. But, many will look at these figures and simply conclude such polling is a successful method rather than concluding they’re artifacts of the process and a unit of analysis that does not support either claim.
The national level: the average misses differently than the poll
The national figures repeat the New York pattern through a mechanism that the margin of error cannot account for. Silver Bulletin froze its final generic-ballot average, the national survey question asking voters which party's House candidate they would support, with Democrats ahead by 8.8 points. The New York Times, estimating the national House vote from district returns, puts the Democratic lead near 13 points, on a base of the two-party House vote. That figure is an estimate, modeled where district returns are incomplete. No completed national count exists to check it against, because the House vote is counted district by district and state by state: the reference standard in this comparison is itself a constructed figure. The gap between the average and the estimated vote is about four points. Across ten states whose final polling averages understated the Democratic margin, a subset selected on the direction of the miss, the average understatement runs about five points. The direction of the 2026 misses is a fact about this cycle: from 2016 through 2024, averages of the same kind had understated Republican support in key races.
A single poll can invoke its stated precision. A generic-ballot poll states a margin of error of about plus or minus three points on a candidate's share. The error bar on a margin between two candidates runs wider, near plus or minus five or six points, because the margin compounds the uncertainty in both shares. A four-point miss sits inside that bar. Averaging cancels the sampling noise that is independent across firms, field periods, and samples, and the sampling error of a mature average shrinks to roughly one percentage point. When the average misses by four, the residual is mostly non-sampling error: the difference between the population that answers surveys and the population that casts ballots. Survey firms screen for likely voters, weight respondents to match demographic targets, and model turnout, and each of those operations encodes a judgment about who will vote. The published averages do not disclose how those screens were built or rebuilt. What can be measured is the distance between the judgments and the vote they were estimating; the methods by which the judgments were made are not in the public record.
Theodore Porter describes numbers of this kind, in Trust in Numbers (1995), as a technology for producing trust at a distance: a polling average lets a reader in one state treat an electorate in another as known, while the judgments inside the instrument, displaced upstream into screens and weighting rules, travel invisibly with the figure.
The seat forecasts then compounded the margin error through district geography. Published House models centered their estimates between 222 and 238 Democratic seats. Preliminary results point to 255 to 258 seats: 17 to 20 seats beyond the top of the published range, and 25 to 28 beyond its center. InsightBridge, whose 2026 scorecard was scored under rules its author registered before the vote, documents the miss in its own work under that pre-commitment. A scoring rule fixed in advance is an accountability device, because the forecast can be graded against a standard its maker could not revise after the count. Which other forecasters registered their rules in advance is not in the public record, so no ranking of the field on that dimension is possible.
The mechanism is arithmetic. A seat model translates a national margin into 435 district outcomes, and when the input margin errs systematically in one direction, districts sitting near the threshold flip together: a four-point error in the input becomes a double-digit error in the output.
A stated range describes the error its maker knows how to model. The 2026 ranges described sampling error faithfully and did not describe the systematic error that arrived, and a consumer of the forecast had no way to see the omission from the forecast itself. Ask of every election number who made it, from what evidence, on what base, under what rule, and at what time.
Two instruments, two constructed publics: polls and prediction markets
Within hours of the results, the claim that prediction markets had beaten the polls had acquired a number, and the number was the maker's own. The published comparison points the other way. On the Monday before the election, Yahoo Finance's comparison put the poll-based models at an 80.3 percent probability of Senate control against a market average of 73.1 percent, and a 96.7 percent probability of House control against 94.1 percent. Kalshi priced a Democratic House at 93.9 percent and Polymarket at 94.5 percent. The instruments pointed the same direction, the poll-based models pointed more confidently, and the outcome matched the direction both had given.
Kalshi's post-election recap states that of 487 races with a Kalshi market that had resolved by 6:00 AM on November 4, the candidates its traders were favoring won 479, which the company reports as 98 percent. The denominator is of the maker's composition and taken at the maker's snapshot: it includes 60 down-ballot statewide races alongside the federal and governor races, and it counts only the races that had finished, 360 of the House's 435 among them, when the races still open at that hour are disproportionately the close ones, a rated toss-up governor's race in Kansas among them. The recap nowhere states the time at which a candidate counts as the favorite, and the claim circulates with at least three measurement times: before a single vote was counted, in the company's own account; before polls closed, in a company researcher's description of the same 479; and, in Polymarket's matching claim of 419 favorites winning of 426 resolved races, one day before the election, the only version that names its time in the claim itself.
The recap's own table does not reconcile: its count column sums to the 479 of 487 it headlines, while its percentage column prints 356 of 360 House races as 95 percent, and two more of its six rows mismatch the same way. No independent accounting of the markets' accuracy on contested races exists in public circulation; the only such computation is one a reader performs on the platforms' published counts. Within a day the headline figure was already drifting in retelling, reported in one trade account as a 96.4 percent hit rate, a number matching neither the platform's counts nor its headline.
The same eight misses yield a different rate against a smaller denominator. By the raters' own pre-election standard, the Cook Political Report's Toss-up and Lean categories, the contested set runs to 50 House districts, roughly 10 to 13 Senate races, and about 10 competitive governor races of 36. A generous allowance for the 60 down-ballot statewide races inside the denominator, for which no published count exists, brings the full contested set to roughly 70 to 90 races. If all eight of Kalshi's misses fell inside that set and every favorite outside it won, this essay's arithmetic on the platform's published counts puts the contested-only accuracy at roughly 89 to 91 percent; if some misses fell outside the contested set, the true contested rate runs higher. For the contested rate to equal the headline 98 percent, the contested set would have to number 400 of the 487. By office, under the same assumption, the implied rate runs from 80 percent on the five governor toss-ups to 92 percent on Cook's fifty House districts. One of the 479 is the race this essay opens with, California's governorship, where the tightest non-campaign poll of the cycle had Becerra ahead of Hilton by 22 points and Kalshi's own late-October price put Becerra at about 96 percent: the correct favorite added one to the numerator and one to the denominator and no information about the instrument's performance on any race whose outcome was in doubt.
The two instruments assemble their evidence from different publics. A poll begins from a sample drawn to resemble the electorate and weights respondents toward demographic targets, which makes the poll's public a construction of the survey firm's design. A market begins from whoever arrives with money and conviction, and weights each participant by stake, which makes the market's public a construction of wealth and confidence. Each differs from the electorate it stands in for. A price is also an output under a rule fixed in advance, and the specifics of those rules are not in the public record. Traders also read polls, so a market price partly re-prices the polling it is said to check, and the independence that would make the comparison clean does not exist. Through the autumn, market prices on Senate control sat below the poll-based models, a pattern consistent with traders discounting the polls in anticipation of a repeat of the polling misses of 2016 through 2024. Read that way, the discount was a judgment about instrument history, applied uniformly. In 2026 the misses ran the other direction, and the discount widened the markets' error instead of correcting the polls'.
The dependence is now argued in public by the model-maker against the market-maker. Nate Silver, whose Silver Bulletin model is the successor to FiveThirtyEight's, answered Kalshi's accuracy claim by arguing that "the better election models were more confident about the outcome than the markets and got there more quickly," and that market prices had converged toward the good models by the end of the race. Silver is a paid adviser to Polymarket, and the critique carries that interest with it. Kalshi answered on a scoreboard of its own choosing, a Brier-score comparison that the markets won. The two sides keep different scoreboards, and each maker published the comparison it won. Silver's position in this argument has a history. FiveThirtyEight's founding reputation rests on the same denominator structure: in 2008 its forecast named the winner in 49 of 50 states and in all 35 Senate races, and in 2012 in all 50 states, in cycles when the genuinely contested set ran to about nine swing states and the remaining forty-odd states were foreordained by any instrument's standard. In 2016 the same kind of model gave Donald Trump a 28.6 percent chance, the highest any major forecaster assigned him, and the cycle's verdict repriced the instrument as a failure on an outcome its own number had allowed. That scorecard crowned Silver in 2008 and 2012. In 2026 he is the critic arguing that the newly crowned instrument's scorecard measures its dependence on models like his. The form recurs because the accolade and the instrument are produced by the same operation: count the foreordained, divide by everything, publish the rate.
Donald MacKenzie's study of financial models, An Engine, Not a Camera (2006), supplies a vocabulary for this feedback. MacKenzie calls a model performative in the generic sense when actors use it inside the process the model describes. Traders re-pricing polls do not meet the generic test: the poll models the electorate, and the traders' use of it runs through a market, outside the process the model describes. His strong form, Barnesian performativity, requires a model's use to make the world conform more closely to the model itself. A forecast would meet that stronger test only through a specific mechanism: a forecast of defeat can dry up the donations, coverage, and organizational support on which a campaign's performance depends, and so help produce the defeat it described.
The levels on which such a mechanism would act are documented. Its operation is not documented. Donation flows responding to forecasts, newsroom budgets set by them, and campaign decisions taken because of them appear nowhere in the public record, and neither does a race in which the mechanism changed an outcome. For mass turnout, no performativity claim is made. For the campaign economy, a candidate mechanism is named, and the claim covers the levels on which it would act rather than its operation.
Propositions: the rule is part of the result
Propositions 40, 41, and 42 on California's ballot were linked by a rule, and none of the three can be read on its own. Proposition 40 proposed a one-time 5 percent tax on the net worth of residents whose net worth exceeded $1 billion. Under the Legislative Analyst's description, the tax would fall on people who were California residents on January 1, 2026, with real estate, pensions, and retirement accounts generally excluded from the base. Ninety percent of the revenue must be spent on health care services for the public, with the rest going to education, food assistance, and administration. The tax would be due in 2027, with an option to spread payment over five years at extra cost, and the Analyst estimates the yield at probably tens of billions of dollars over several years, against a possible ongoing decrease in state income-tax revenue of less than $1 billion a year. Proposition 41 would require the State Auditor to review proposed special-tax programs before the ballot and to review special-tax programs on a regular cycle; it would also end the exclusion of a new special tax's revenue from the state spending limit, an exclusion Proposition 40's revenue carries. Proposition 42 would bar the state from establishing new taxes on owners of financial assets or other personal property and would restrict certain retroactive taxes.
Propositions 41 and 42 were also written so that either one nullifies Proposition 40 if it draws more yes votes than Proposition 40 does, even if Proposition 40 wins a majority of its own votes. The rule behind the device is Article II, Section 10(b) of the state constitution: where measures approved at the same election conflict, the provisions of the measure with the highest number of affirmative votes prevail. The outcome of the three measures is therefore joint: a product of three yes-vote totals and an interaction rule, and no single total describes it.
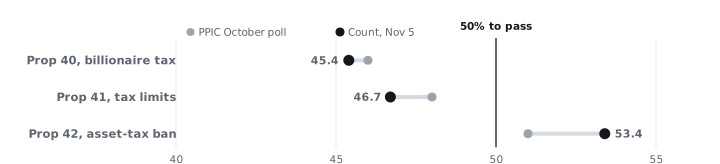
The polls measured the three shares separately, and measured them well: each October figure landed within its stated margin of error of the count that followed. The Public Policy Institute of California surveyed 1,086 likely voters between October 16 and 22, with a stated margin of error of plus or minus 3.8 points, and found yes support at 46 percent for Proposition 40, 48 percent for Proposition 41, and 51 percent for Proposition 42. Berkeley's Institute of Governmental Studies poll agreed on the consequential ranking, placing Proposition 42 ahead of Proposition 40 by 43 to 42. PPIC's September survey had Proposition 40 at 52 percent yes, so the autumn trend ran downward through the polling. The Secretary of State's count on November 5 put the measure at 45.4 percent yes, and the measure had not been called. The same count stood at 46.7 percent for Proposition 41 and 53.4 percent for Proposition 42.
Those three shares were made comparable by a single operation, and two different makers performed it. Survey organizations converted three differently worded questions into yes percentages on a single scale, which produced a forecast of the ranking. The electoral apparatus then performed the operative conversion, rendering the three measures as yes-vote totals under ballot language fixed by law, and the interaction rule acted on that ranking. Espeland and Stevens, in "Commensuration as a Social Process" (1998), describe commensuration as this kind of conversion, in which unlike things are rendered in a common metric and the rendering creates relations that did not exist before it. The distinction between the two conversions is the maker: a survey house's design choice in the first case, a statutory act in the second. On the November 5 count, Proposition 42's yes share stood above Proposition 40's, the ranking the October polls displayed.
The comparison rests on one substitution: the rule counts yes votes, while the polls compared yes shares, and the conversion discards the rest of what the questions carried, the undecided and the unequal electorates the three measures drew. If the certified yes votes preserve the ranking, Proposition 40 would not take effect under the conflict rule, even if its own share settles above 50 percent. Whether the two measures conflict is a question the Legislative Analyst notes the courts could be asked to decide. A reader tracking only Proposition 40's distance from a majority would have misread the result for the entire fall.

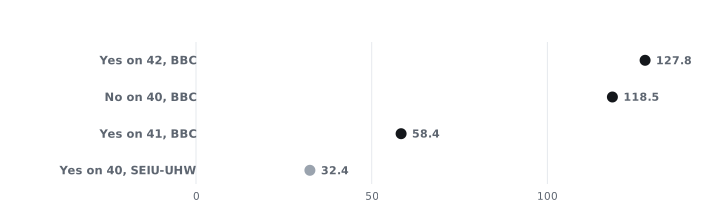
The three measures also show spending aimed at the ballot's composition as well as its outcome. A committee called Building a Better California, co-founded in February 2026 by Sergey Brin and Eric Schmidt, raised more than $333 million and allocated $304.65 million across the three campaigns, according to the Fair Political Practices Commission's top-contributor lists of October 22: $127.8 million supporting Proposition 42, $118.5 million opposing Proposition 40, and $58.35 million supporting Proposition 41. The committee supporting Proposition 40, sponsored by the healthcare workers' union SEIU-UHW, reported about $32.4 million. The ratio of the one side's allocated total to the other side's reported total stands at roughly 9.4 to 1, and both figures are outputs of the disclosure system as of October 22. The Los Angeles Times counted about $293 million contributed by 30 donors, themselves among the state's roughly 260 billionaires, in the Times's own framing of the donor pool.
California's money can be stated to a date in October because a disclosure system compels committees to file on a schedule and publishes the result. The construction of a single likely-voter screen cannot be stated at all, because no equivalent filing exists for a reader to consult. The density of public knowledge about an election tracks the disclosure obligations imposed on its producers, which is a property of the infrastructure, not of the questions' importance.
Propositions 41 and 42 qualified through a funded signature-gathering campaign: about $99 million, at rates up to $15 per signature reported in the San Francisco Standard's review of the filings. Proposition 40 was the SEIU-UHW committee's own measure, and its qualification cost is not broken out in the public record. Qualifying a measure and persuading voters about one are different exercises of money, and in this cycle the documented qualification spending sits on the side of Propositions 41 and 42. Whether advertising moved any of these shares is a question the available evidence does not settle, for any spender, and a shared timeline does not settle it either. The documented sequence is this: about $144 million went to advertising, most of it in September and October, the same window in which PPIC's Proposition 40 yes share fell from 52 to 46 percent.
The governorship was on the same ballot, and the pairing complicates any summary of what California's voters wanted. In the November 5 count, Becerra stood at 64.7 percent of the vote while Proposition 40, the SEIU-UHW committee's measure, stood at 45.4 percent yes, one electorate answering two questions in two directions on the same ballot. Other electorates decomposed along office lines without splitting against themselves. Pennsylvania's count had Shapiro ahead by 22.1 points, and the state's voters, in the same election, voted out four Republican House incumbents. New York State's count had Hochul ahead by about 19.6 points, and New York City's voters, a distinct electorate deciding distinct questions, had all five of the city's charter proposals passing, on unofficial city figures. Each result arrived under its own rules, at its own margin, from its own electorate, and none of them can stand in for the others.
The voters' product is a set of decisions differing by office, question, and rule, and a summary that collapses that set into one figure has made an editorial decision and presented it as a measurement.
The county layer: thresholds, districts, and time
At the county layer, measurement is at its thinnest, and the count is the first instrument to measure it. Redwood City's Measure E proposed rent control for apartments built before 1995, capping the rents their tenants pay; tenants in newer buildings were outside it. No polling firm surveyed it and no outlet published a prediction. San Mateo County's first report, issued at 1:53am on November 4, put yes at 43.74 percent of votes counted to that point. Wednesday returns put the measure at 6,348 yes votes against 8,164 no votes, about 44 percent yes. For a month, the figure governing public discussion is a provisional count, and tenants, landlords, and city officials are already acting on it.
Measure W, a bond of up to $498 million for the San Mateo-Foster City School District, shows the threshold variant of the same structure. The money would repair roofs, build STEM labs and career-technical shops, upgrade fire and security systems, and fund teacher workforce housing. School bonds in California pass at 55 percent under Proposition 39, so the operative figure is the measure's distance from 55 rather than from a majority. The county's first report, issued with Measure E's at 1:53am on November 4, put Measure W at 60.41 percent yes, about five points above the threshold. District property owners would pay an estimated average tax rate of $29 per $100,000 of assessed value, about $232 a year on a home assessed at $800,000, and total repayment is estimated at about $900 million through 2054-55 if the bonds are fully issued. The roughly $400 million difference between the amount borrowed and the amount repaid is the cost of the borrowing, spread across district property owners through 2054-55.
A bond standing at 53 percent yes would lead in majority terms and lose in law. The number the district's facilities plans turn on is the distance from the threshold, and the distance from 50 would decide only an ordinary majority.
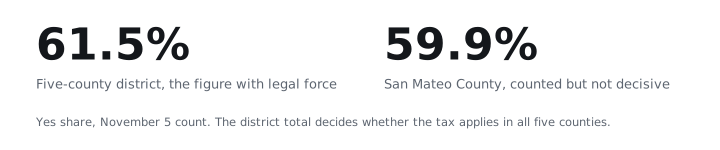
The Regional Transit Measure was voted on as a single district spanning five counties, and the district total, assembled from the five counties' counts and reported by the Metropolitan Transportation Commission, stood at 61.5 percent yes on November 5. San Mateo County's voters, counted separately, stood at 59.9 percent yes on the same date. Both numbers accurately count the ballots counted to that point, and they answer different questions. Only the district figure has legal force: approval would raise the sales tax rate in Redwood City from 9.875 percent to 10.375 percent for fourteen years, on the strength of a majority assembled across five counties rather than within any one of them.
Under the measure as written, the tax would fall on purchasers at the register in all five counties, at one percent in San Francisco and half a percent in each of the other four, so San Francisco purchasers would pay at twice the rate of the other four counties into a single district pool. Collection would begin in April 2027, on revenue the Metropolitan Transportation Commission estimates at about $980 million a year, about $13.7 billion over the tax's fourteen years on that estimate. About 63 percent of it would fund operations at Bay Area Rapid Transit (BART), the San Francisco Municipal Railway (Muni), Caltrain, AC Transit, the San Francisco Bay Ferry, East Bay bus agencies, and Golden Gate Transit; BART's fixed share alone is 31 percent of the revenue, about $304 million a year. Most of the rest, about a third of the total, would go to county transportation entities: the Santa Clara Valley Transportation Authority would take 25.1 percent of the total, the San Mateo County Transit District (SamTrans) 4.7 percent, and the Contra Costa Transportation Authority and the Alameda County Transportation Commission would divide the remaining few points of that share between them, for local priorities. About 5 percent would fund rider improvements: wayfinding, accessibility upgrades, and discounted fares for low-income riders. The framework and the measure have different authors. Senate Bill 63 created the district and authorized the tax in 2025, and the rates and the allocation schedule were written into the citizen initiative that carried the measure to the ballot. The Metropolitan Transportation Commission would administer the operating and rider-improvement funds and, as Senate Bill 63 requires, conduct financial efficiency reviews of BART, Muni, Caltrain, and AC Transit.
A county's own vote does not decide whether its residents pay the tax; the district total does, under the aggregation the law specified before the first ballot was cast. The choice of unit, county or district, is a political decision encoded in the measure's design, and it precedes and constrains every number the count can produce.
The unmeasured bottom of the ballot, and the first explanation
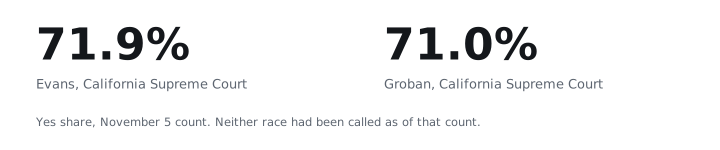
Measurement coverage follows money and contest, and the bottom of California's ballot shows where it stops. The ballot carried 64 judicial retention votes. None of the 64 justices faced an opponent. Voters decided each one by a yes or no vote on retention, and the two statewide cases, Supreme Court Justices Kelli Evans and Joshua Groban, stood at 71.9 and 71.0 percent yes in the November 5 count. Neither race had been called as of that count, and the reason for the delay is not in the public record. A retention vote at 71 percent, against no opponent, had drawn no call two days after the election, in a cycle when a governorship was called in one minute. Retention would give Groban a twelve-year term, among the longest mandates on the ballot. No California appellate justice has lost a retention vote since 1986, and no polling firm surveyed any of the 64 races this cycle.
The five charter proposals from Mayor Mamdani's Commission on Government Efficiency, covering public-space permits, city contracting, street projects and leases, building permits, and a rainy-day-fund target, tell the same story: all five were passing on unofficial city figures, with yes shares between about 62 and 72 percent, and no public pre-election polling of them exists. The offices and questions with the least measurement include some with the longest consequences. The public record does not answer who pays for the instruments themselves, for a survey, an exit poll, or a decision desk, or what that payment buys in attention.
The explanation layer arrives faster than any of these counts and rests on a narrower base than any of them. CBS's exit poll reported that 89 percent of the voters its interviewers reached called cost of living an important or key factor in their vote, and that presidential approval stood at 38 percent among the same voters. The base for those figures is voters whom interviewers reached on and before election day, which excludes by construction every nonvoter. The figures nonetheless became the standard explanation of the election within a day of its close.
The mechanism by which an explanation becomes standard is not in the public record; the larger claim, that the poll reshaped the public's own understanding of its vote, would require evidence the public record does not contain. The first explanation of an election comes from the instrument whose base is confined by construction to people who voted.
The visual layer performs a conversion of its own: a tile cartogram of the House set beside a geographic map of the same results renders each congressional district as a cell of equal size. A companion tool, Poll, Call, Count, Certified, keeps the same separation for fifteen of these races and measures, stage by stage, with each figure's maker, date, and base attached and the empty stages left visible. That offsets the land-area effect of the geographic map, where sparsely populated districts loom far larger than their population share. The geographic map weights land; the cartogram weights districts. Each cell's color inherits the status of the number behind it, a call at one hour and a count at another.
Certification, and the audit that only runs on failure
Until San Mateo County certifies on December 3 and the California Secretary of State on December 11, every California figure is semi-official. The count that grades every other instrument is itself produced at every level: county by county, under state rules and deadlines that differ, released in batches with as-of dates attached, and revised as late ballots are processed. Certification is the step that stops the revision. It converts a running count into the legal fact from which terms begin, taxes take effect, and retention clocks start. In California an approved initiative takes effect on the fifth day after the Secretary of State files the statement of the vote, which is December 16 for this cycle, unless the measure sets its own later operative date, as the transit tax does, and the governor elected on November 3 takes office on January 4. Certification is the one instrument in the stack whose output is a legal act rather than a description. Sheila Jasanoff's name for this kind of joint production is co-production, set out in her introduction to States of Knowledge (2004): knowledge and social order are produced together. The pattern runs through the stack, in the publics the polls and markets construct and in the choice of unit the transit measure encodes. Certification is its clearest instance: the act that produces the official number is the act that sets its legal consequences in train, each on its own date.
No desk audits a call that comes out right. The one forecaster in this cycle that can be graded against a standard it could not revise is the one that registered its rules before the vote. The desks that called two governorships within minutes of the polls closing face no equivalent check, because the check runs only on visible failure. So the patterned misses sit unexamined under the correct calls: the four points in the national average, the seven in New York, the twenty-five to twenty-eight seats. The instruments will be back in two years carrying the same screens, the same weighting rules, and the same snapshot times, and the only audit they will ever get is the one a reader runs when a number arrives: who made it, from what evidence, on what base, under what rule, and at what time.